Introduction
As solar street lights gain momentum in global infrastructure projects, distributors face intensifying price competition. However, savvy procurement strategies can transform cost pressures into profit opportunities. This guide dissects the true drivers of solar street light costs and reveals underutilized profit channels for distributors.
Section 1: The Visible Cost Matrix – What You Pay For
- Core Components Breakdown
- Solar Panels (18-22% of total cost): Tier-1 vs. Tier-2 efficiency trade-offs.
- Batteries (25-30%): Lithium-ion vs. lead-acid lifecycle ROI analysis.
- LED Luminaires (15-20%): Chip quality (LM80-certified vs. generic) and IP ratings.
- Poles & Mounting (10-15%): Galvanized steel vs. aluminum cost/durability balance.
- Hidden Manufacturing Variables
- MOQ thresholds: How order volume impacts unit pricing (case study: 500 vs. 5,000 units).
- Certification costs (CE, IEC, TUV): Pre-certified suppliers vs. self-certification risks.
Section 2: The Invisible Cost Drain – What Eats Margins
- Logistics Pitfalls
- Sea freight vs. air freight break-even points for urgent orders.
- Incoterms traps: Why “CIF” often costs more than “FOB + 3PL partnership”.
- Post-Sale Cost Bombs
- Warranty claims: The $18-$35/unit risk of uncertified controllers.
- Duty structures: ASEAN vs. African markets tariff optimization models.
Section 3: Profit Multipliers – Where Smart Distributors Win
- Demand-Driven Customization
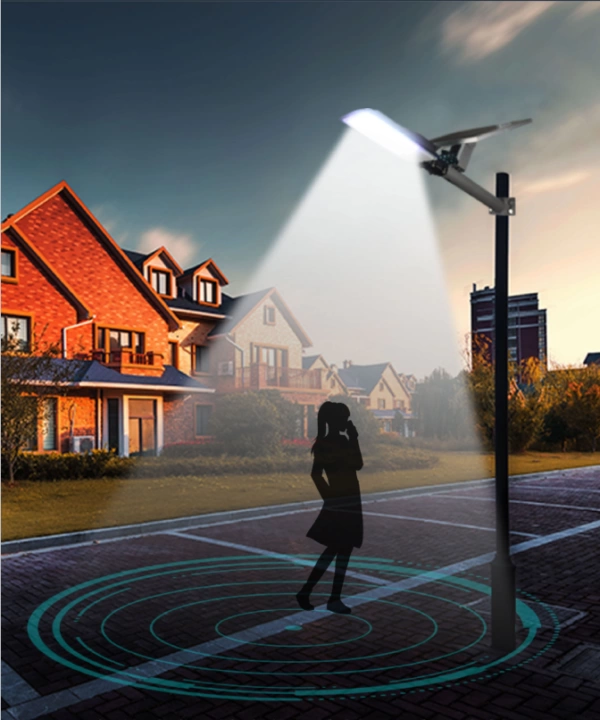
- High-margin add-ons: Motion sensors (+12-18% ASP), smart IoT controls (+25-30% ASP).
- Regionalized bundling: Desert-grade dustproofing (MENA) vs. typhoon-resistant designs (APAC).
- Supplier Collaboration Models
- Consignment stock agreements to reduce capital lockup.
- Co-branded technical training programs (5-8% service revenue boost).
- Policy-Driven Incentives
- Leveraging government subsidies (e.g., India’s SOLAR PARK initiative).
- Carbon credit monetization for large-scale deployments.
Case Study: How a European Distributor Increased Net Margins by 14%
- Problem: 22% returns due to battery failures in Nordic winters.
- Solution: Switched to low-temp LiFePO4 batteries (+9% upfront cost, -62% warranty claims).
- Profit gain: $126,000 annual savings + premium pricing for “Arctic-grade” SKUs.
Conclusion: The 80/20 Rule of Procurement
Focus 80% of negotiation energy on the 20% components that dictate 65% of total costs (batteries, panels). Meanwhile, build long-term supplier partnerships to unlock hidden profit streams – because in solar lighting, visibility isn’t just about lumens; it’s about seeing the full financial picture.
CTA (Call to Action):
Audit your procurement strategy today: [Download our Solar Street Light Total Cost of Ownership (TCO) Calculator] to model scenarios and identify YOUR profit leaks.